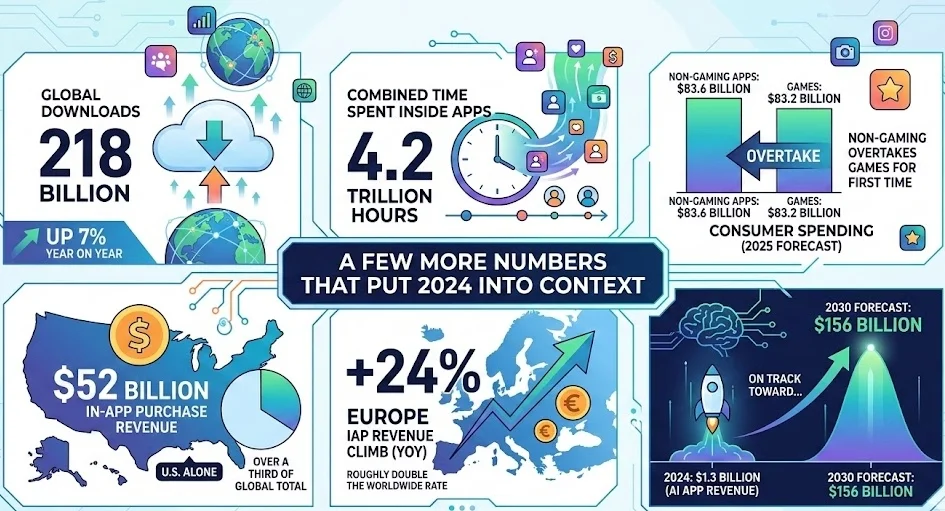
Non-gaming apps made more money than games for the first time ever in 2025. $83.6 billion versus $83.2 billion. That gap is only four hundred million dollars on a base of eighty-three billion which is essentially a tie but the direction matters because five years ago games dominated app store spending so completely that everything else looked like a rounding error. Productivity apps and finance apps and health apps were barely monetised. Now they are pulling in more combined revenue than the entire mobile gaming industry.
Sensor Tower confirmed the broader picture in their State of Mobile report — in-app purchase revenue across iOS and Google Play hit $150 billion in 2024, up 13% on 2023 and the fastest growth since 2021. Statista put total global app revenue between $530 and $540 billion for the year. Add mobile advertising which reached $419 billion in 2025 per Business of Apps and the combined economy is past $600 billion. Downloads hit 218 billion globally. People spent 4.2 trillion hours inside apps. The U.S. alone was responsible for $52 billion in in-app purchases and Europe grew at 24% year on year which is roughly double the global rate.
Those numbers are interesting at a macro level but they do not really tell you anything about what actually happens when a specific company decides to build an app and measure whether it worked. The companies where the data is public and the results are hard to argue with are more useful to look at than the aggregate.
Starbucks is the one that changed how people think about this
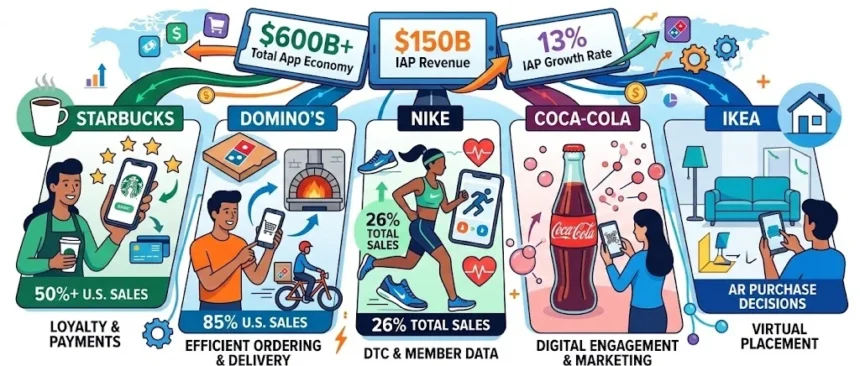
Starbucks launched its app in 2009 as a store locator which is kind of funny given what it turned into. Mobile payments came in 2011. Mobile order-and-pay in 2014. And by the time most retailers had even started discussing whether they needed an app Starbucks was already processing a huge chunk of its U.S. sales through one.
The numbers now are genuinely difficult to believe if you do not know the backstory. Over 30 million Americans use the app for payments. The Rewards program drives over 50% of all U.S. sales. More than half. Users with the app are 5.6 times more likely to visit a store every single day which sounds impossible until you remember that coffee is a daily habit for most of these people and the app is not creating demand it is just making sure that demand goes to Starbucks instead of the place next door.
Revenue is past $34 billion annually now. Back in 2013 the company already had $621 million sitting in mobile platform assets.
But the part that does not get talked about enough is what the app did to transaction costs. Payments through Starbucks’ own system bypass third-party credit card networks. That is not a loyalty play. That is a bank move. Forrester Research called it “possibly the most successful mobile ordering app of all time” and nobody has really challenged that since.
Domino’s and Nike took opposite approaches and both worked
Domino’s went all in on digital ordering starting in 2010. 85% of U.S. retail sales now come through digital channels. Global retail sales hit $19.1 billion in 2024. In the UK app orders went from 52.2% of online orders in 2022 to 76.3% in 2024. Revenue for fiscal 2024 was $4.706 billion up 5.07% from 2023 and Q2 2025 operating income rose 14.8%. India crossed 2,000 stores by June 2024, first country outside the U.S. to do that. Eighty-five percent digital for a pizza company is wild. Their chief digital officer said in 2015 they had “collapsed the pizza ordering experience completely” and at the time that sounded like someone who just walked out of a marketing meeting but the numbers since then have basically proven him right.
Nike went a different direction entirely. Instead of digitising one transaction they built a whole ecosystem — Nike app, SNKRS, Run Club, Training Club — and used all of it to sell directly to consumers and cut out wholesale.
Nike Direct revenue reached $21.3 billion in fiscal 2023, up 14%. Nike Digital grew 24% that same year. Digital went from 10% of total sales in 2019 to 26% by 2023 which is a massive shift in four years. Total company revenue hit $51.4 billion in fiscal 2024 and NikePlus members shopping through the app spend 3x what guest shoppers spend on Nike.com. The company invests roughly $1.3 billion per year on IT and digital which is serious money for a channel that still accounts for only a quarter of revenue.
Then they pulled back. Digital sales softened in a couple of quarters through 2024 and 2025 and Nike quietly rebalanced toward wholesale again. The narrative for three years had been about cutting out the middlemen and going direct. Turns out the middlemen still move a lot of shoes. The customer data and membership base those apps built is not going anywhere though, it is just operating alongside wholesale now instead of replacing it.
Coca-Cola and IKEA showed it works outside retail and food too
Coca-Cola invested in app-based marketing and digital engagement across its brand portfolio. By Q2 2021 revenue had already surpassed pre-pandemic 2019 levels — $10.13 billion against an expected $9.32 billion. The recovery happened faster than most analysts thought possible and digital touchpoints played a measurable role.
IKEA did something nobody expected to actually work. The Place app let customers photograph their actual room and drop IKEA furniture into it with augmented reality before buying. When it launched a lot of people dismissed it as a tech demo but it changed how purchase decisions happened because people started deciding what they wanted from their couch instead of walking through a showroom trying to imagine a display piece in a completely different room. Walmart built similar AR into their app after seeing what IKEA had done and now processes hundreds of millions of mobile transactions monthly.
How these five compare at a glance
| Brand | App launch | Digital share of revenue | Key revenue figure | What the app changed |
| Starbucks | 2009 | 50%+ of U.S. sales | $34B+ annually | Payments, loyalty, repeat visits |
| Domino’s | 2010 (rebuild) | 85% of U.S. sales | $19.1B global retail | Ordering, delivery, operations |
| Nike | 2018 (ecosystem) | 26% of total sales | $21.3B direct revenue | DTC sales, customer data, margins |
| Coca-Cola | Ongoing | Not disclosed separately | $10.13B (Q2 2021) | Marketing, engagement, recovery |
| IKEA | 2017 (Place app) | Growing | Not disclosed | Purchase decisions moved to mobile |
Building these apps got cheaper and faster and that changes who can afford them
Every one of those companies spent serious money. Nike’s digital budget alone is $1.3 billion a year. Starbucks had $621 million in mobile assets back in 2013. That kind of spend is not available to the vast majority of businesses and for a long time that was the honest answer to “should we build an app” for most companies — you probably cannot afford to do it well enough to matter.
That equation is changing though. The development market has shifted significantly in the last two years.
Straits Research has the global mobile app development market at USD $269.49 billion for 2024. They project it hits $302 billion next year and reaches $753 billion by 2033 at a 12.1% CAGR. Mordor Intelligence scoped the enterprise segment at $168.45 billion for 2025 growing to $303.56 billion by 2030. Those are big projections but the reason the market is expanding is not just more companies building apps, it is that each app costs less to build than it used to.
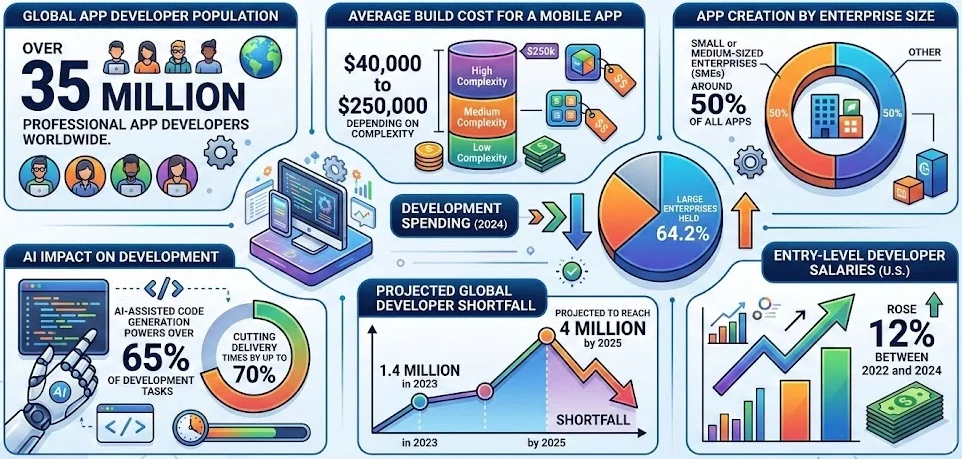
- Over 35 million professional app developers worldwide.
- Average build cost: USD $40,000 to $250,000 depending on complexity.
- Around 50% of all apps are built by small or medium-sized enterprises.
- Large enterprises still held 64.2% of development spending in 2024.
- AI-assisted code generation powers over 65% of development tasks now and cuts delivery times by up to 70%.
- Global developer shortfall: 1.4 million in 2023, projected 4 million by 2025.
- Entry-level developer salaries in the U.S. rose 12% between 2022 and 2024.
That 70% delivery time reduction from AI tooling is the number that matters most on this list. Companies that looked at custom mobile app development services three years ago and immediately said no because the timeline was eighteen months and the budget was half a million dollars are now getting proposals back that look completely different. The math changed. And the developer shortage is accelerating that shift because when there is a four million person gap in the global talent pool you are not staffing an in-house team from scratch. You outsource or you go low-code or you combine both and most businesses figuring this out right now are landing on some version of that combination.